Bathymetric Surveys

BATHYMETRIC Surveys

Precise Depth Measurement & Seabed Mapping

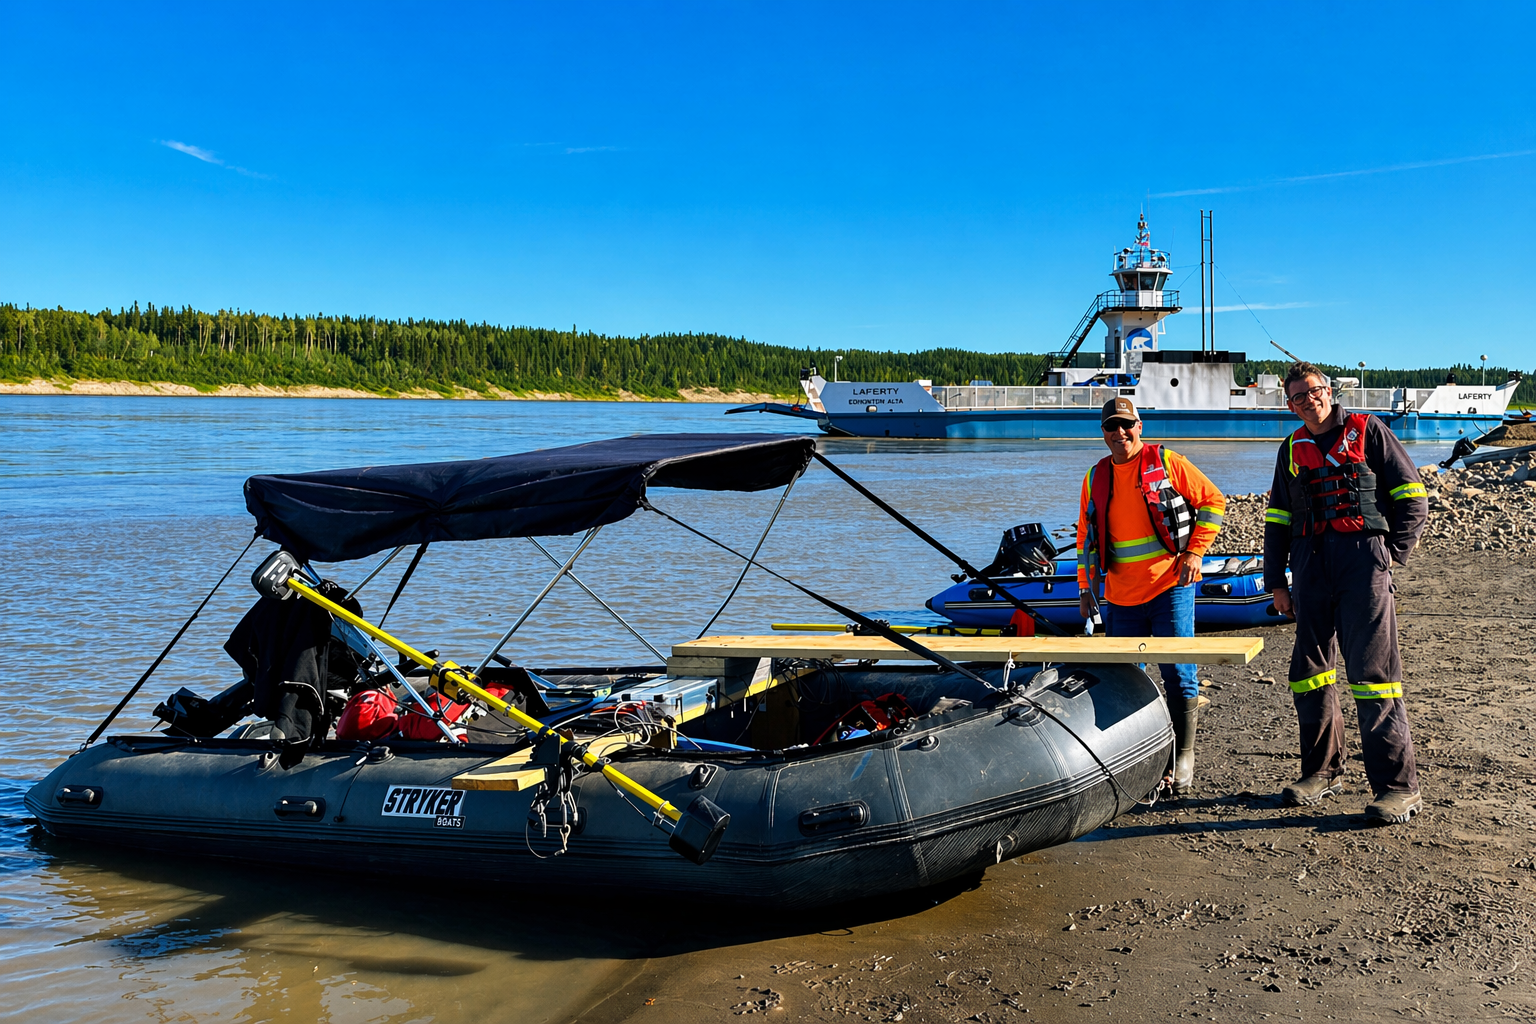
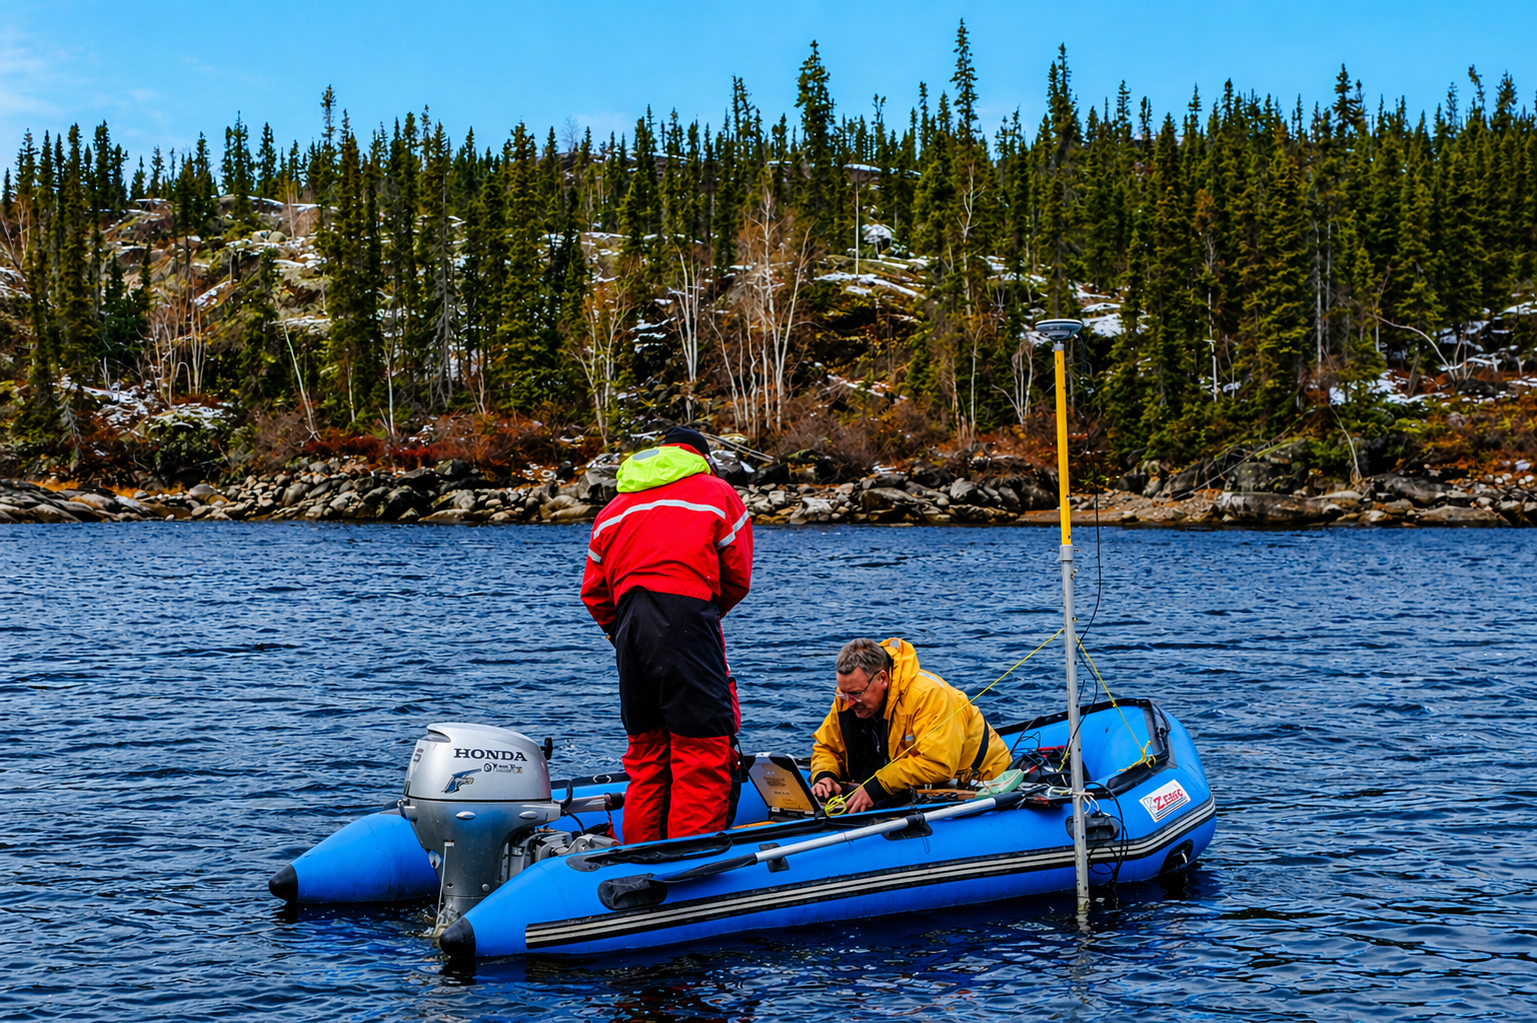
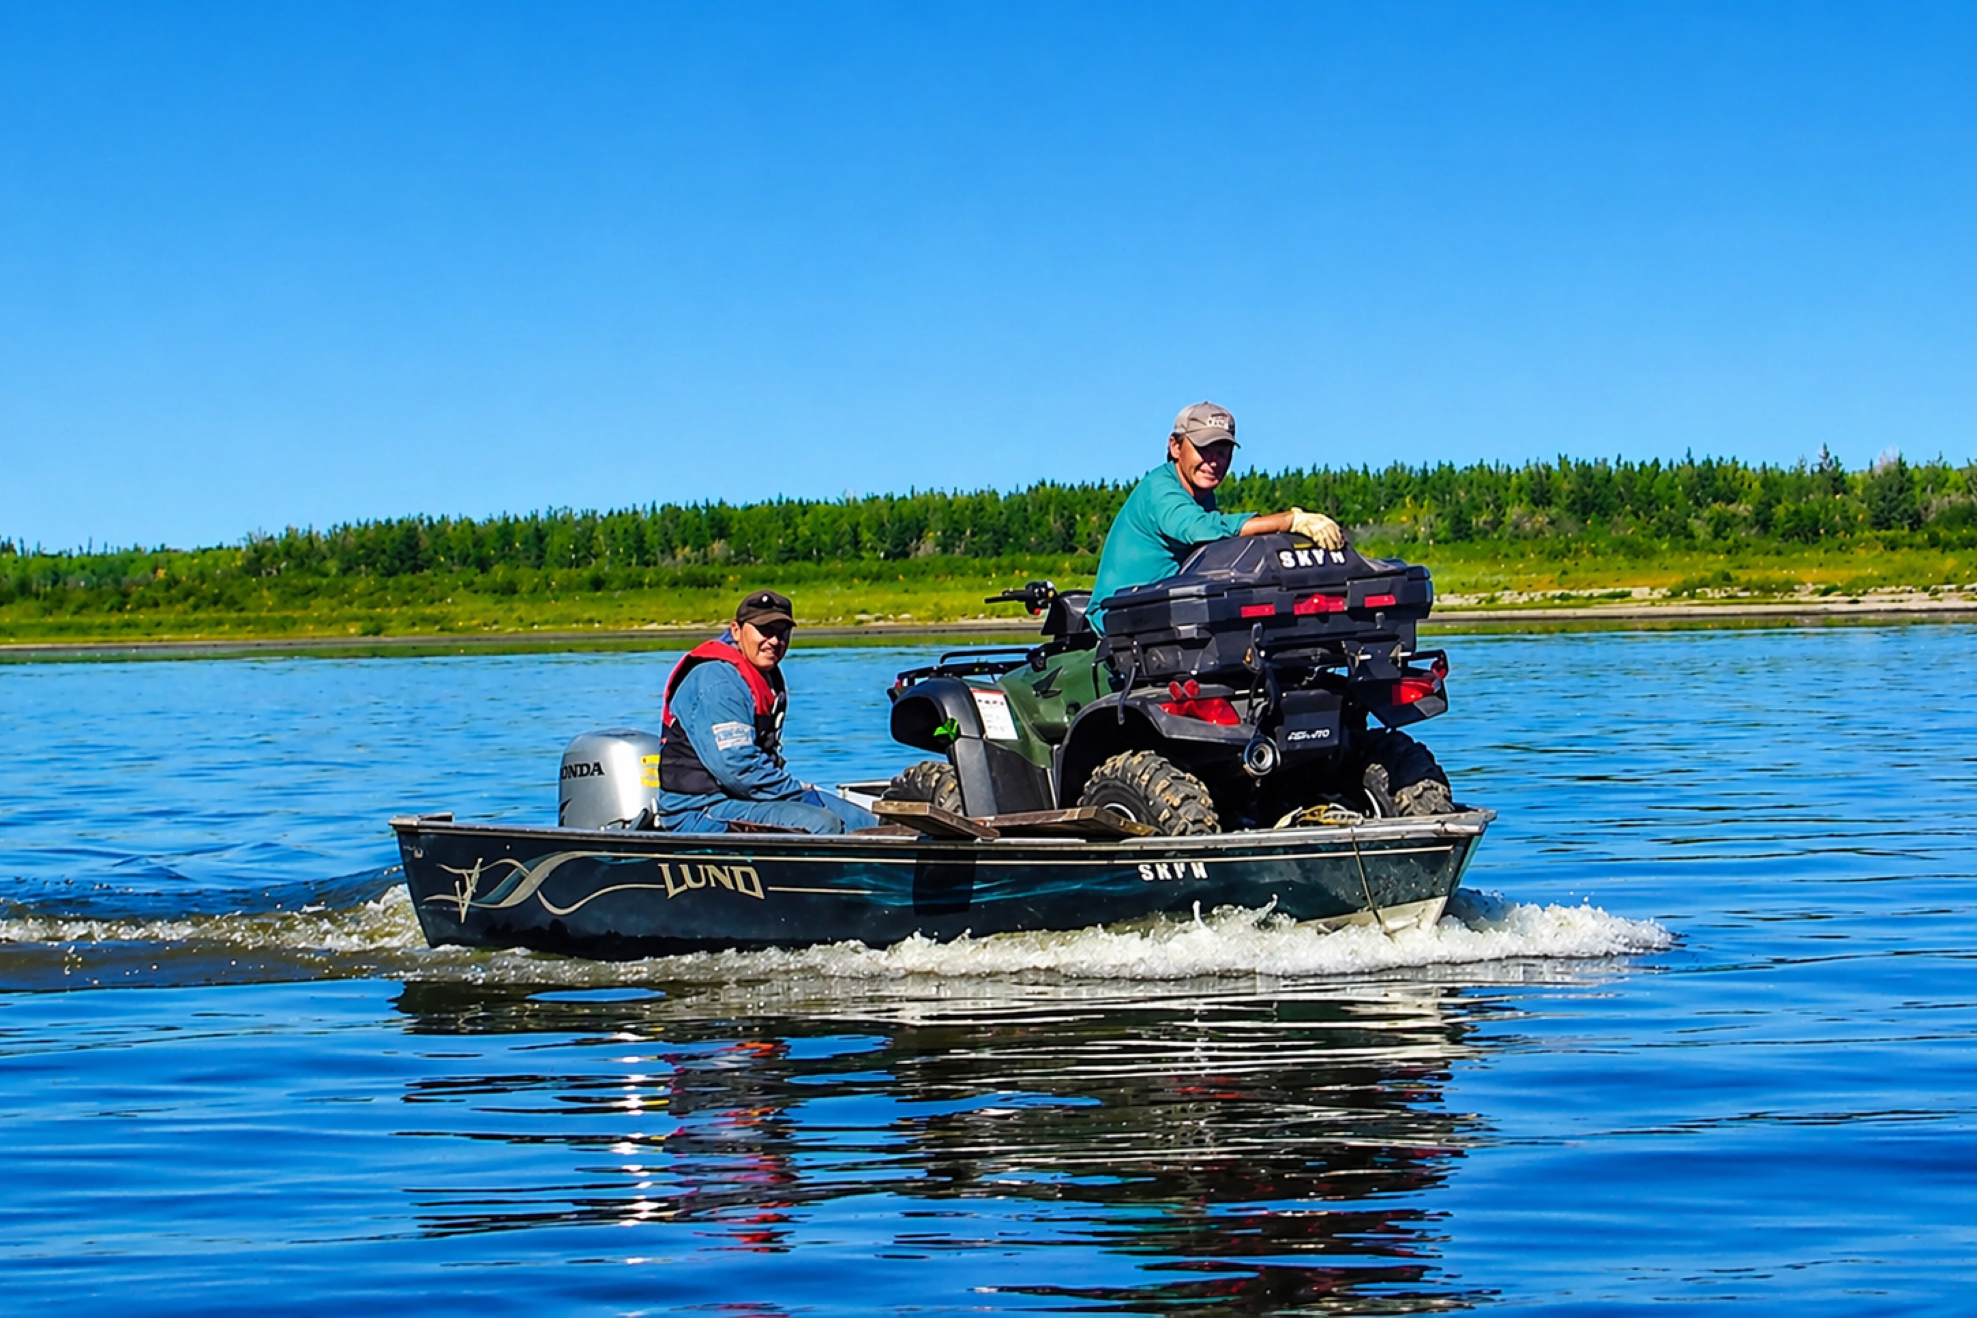
Ollerhead & Associates provides highly accurate hydrographic surveys throughout the Northwest Territories and Nunavut. Our extensive experience and advanced technology allow us to conduct and manage large-scale projects across vast geographical areas.

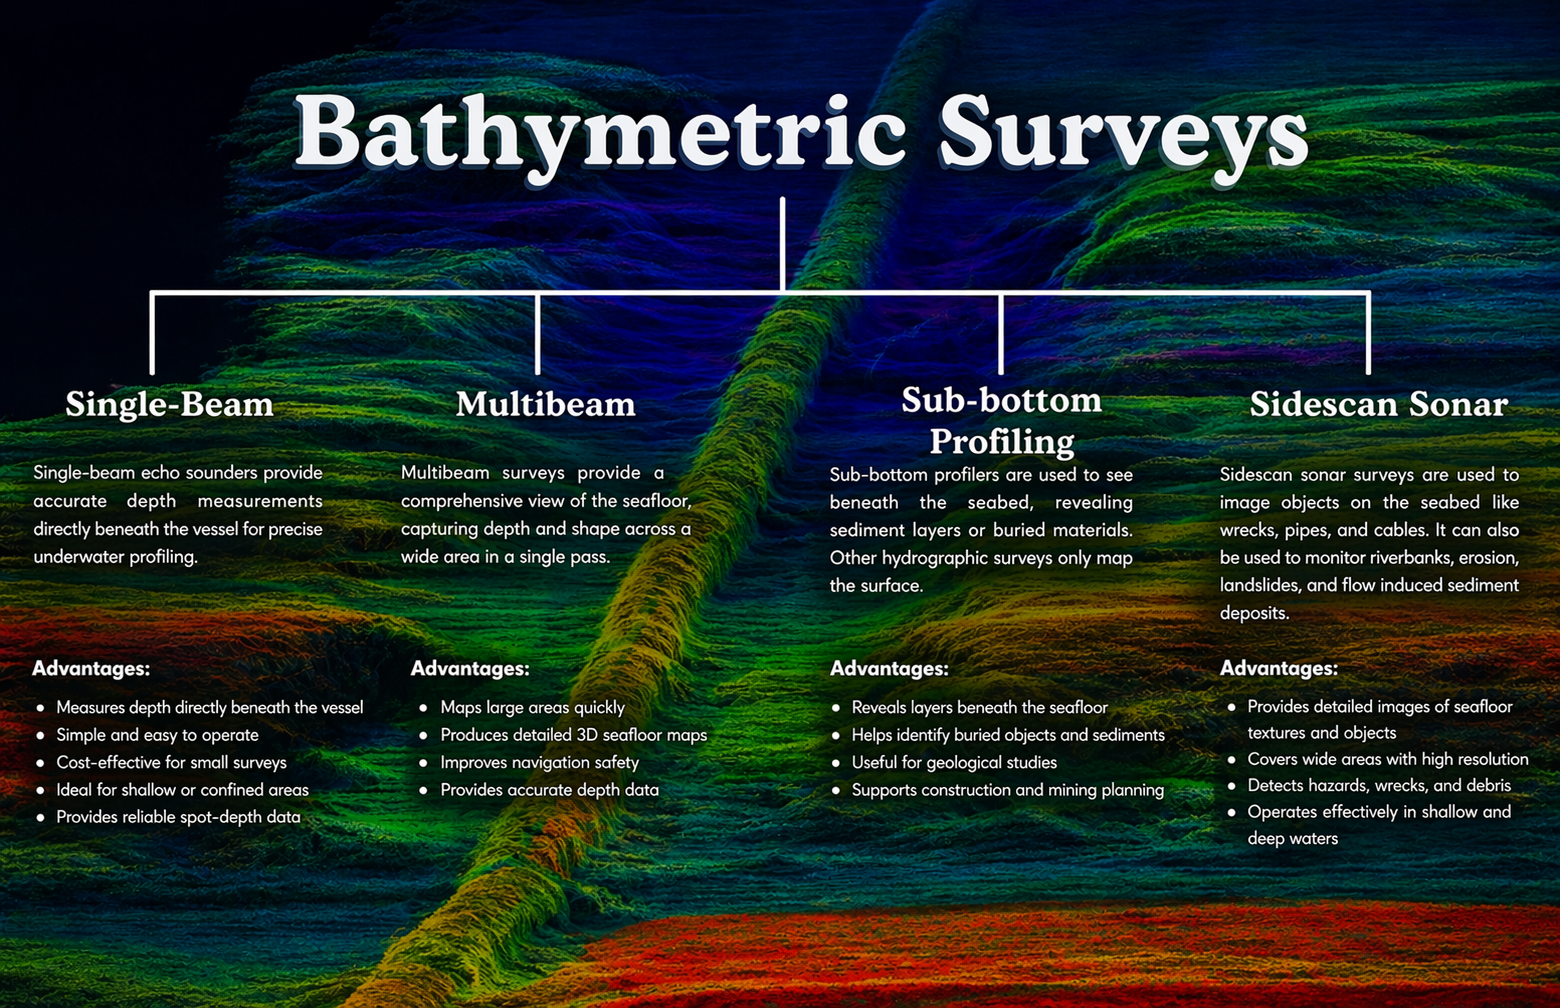
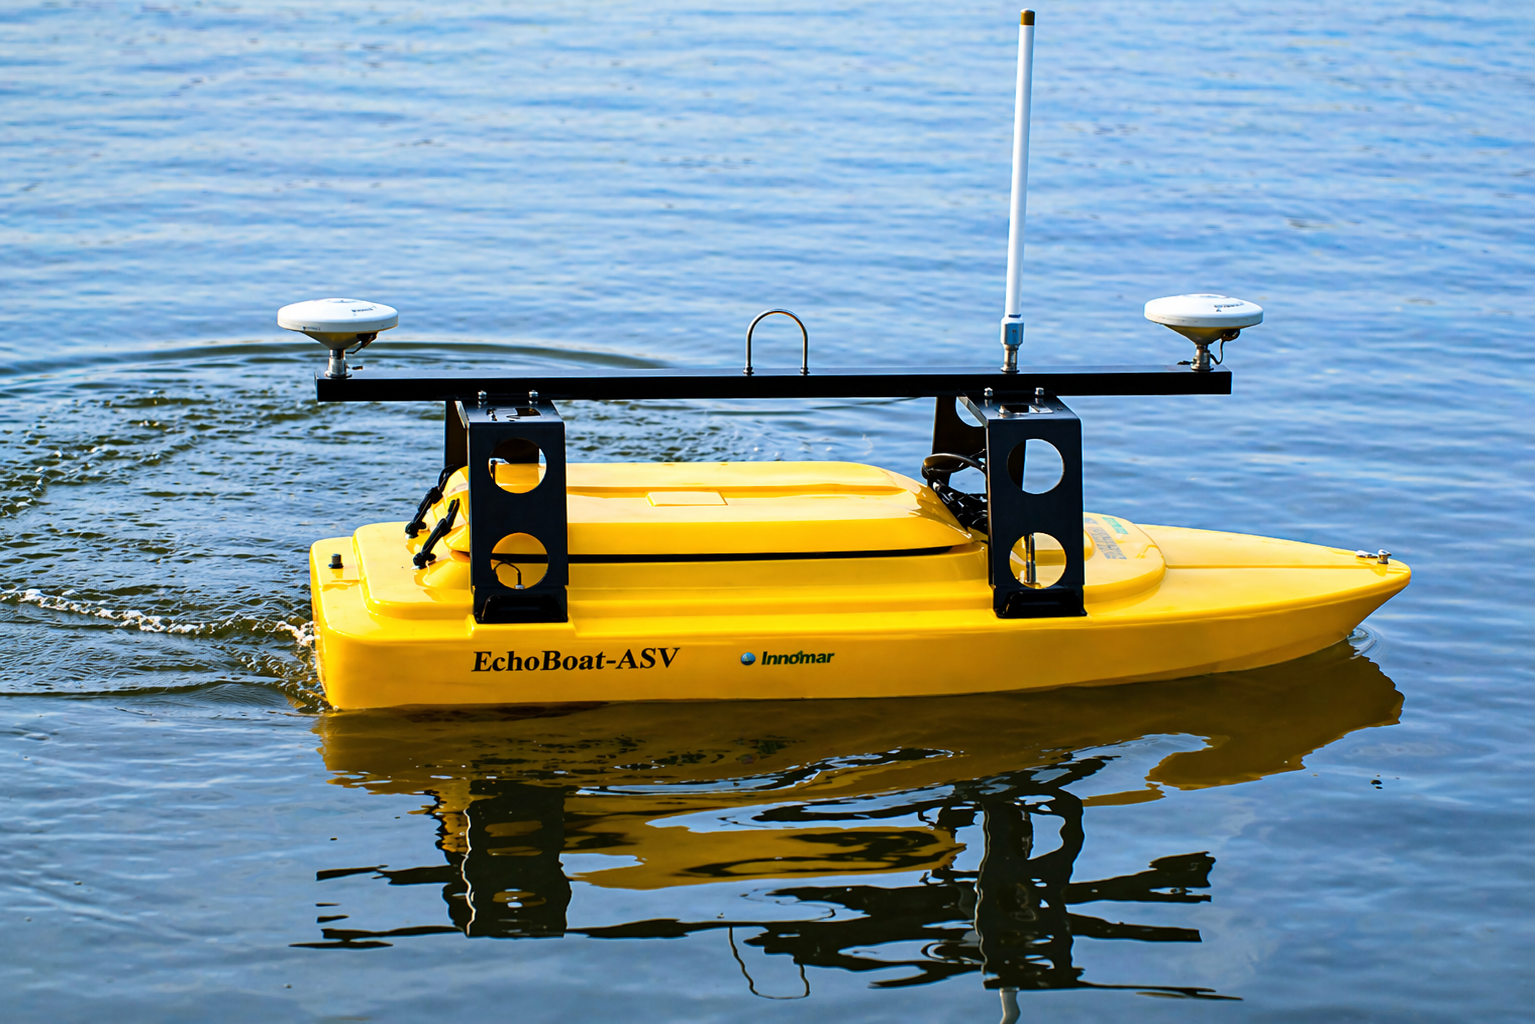
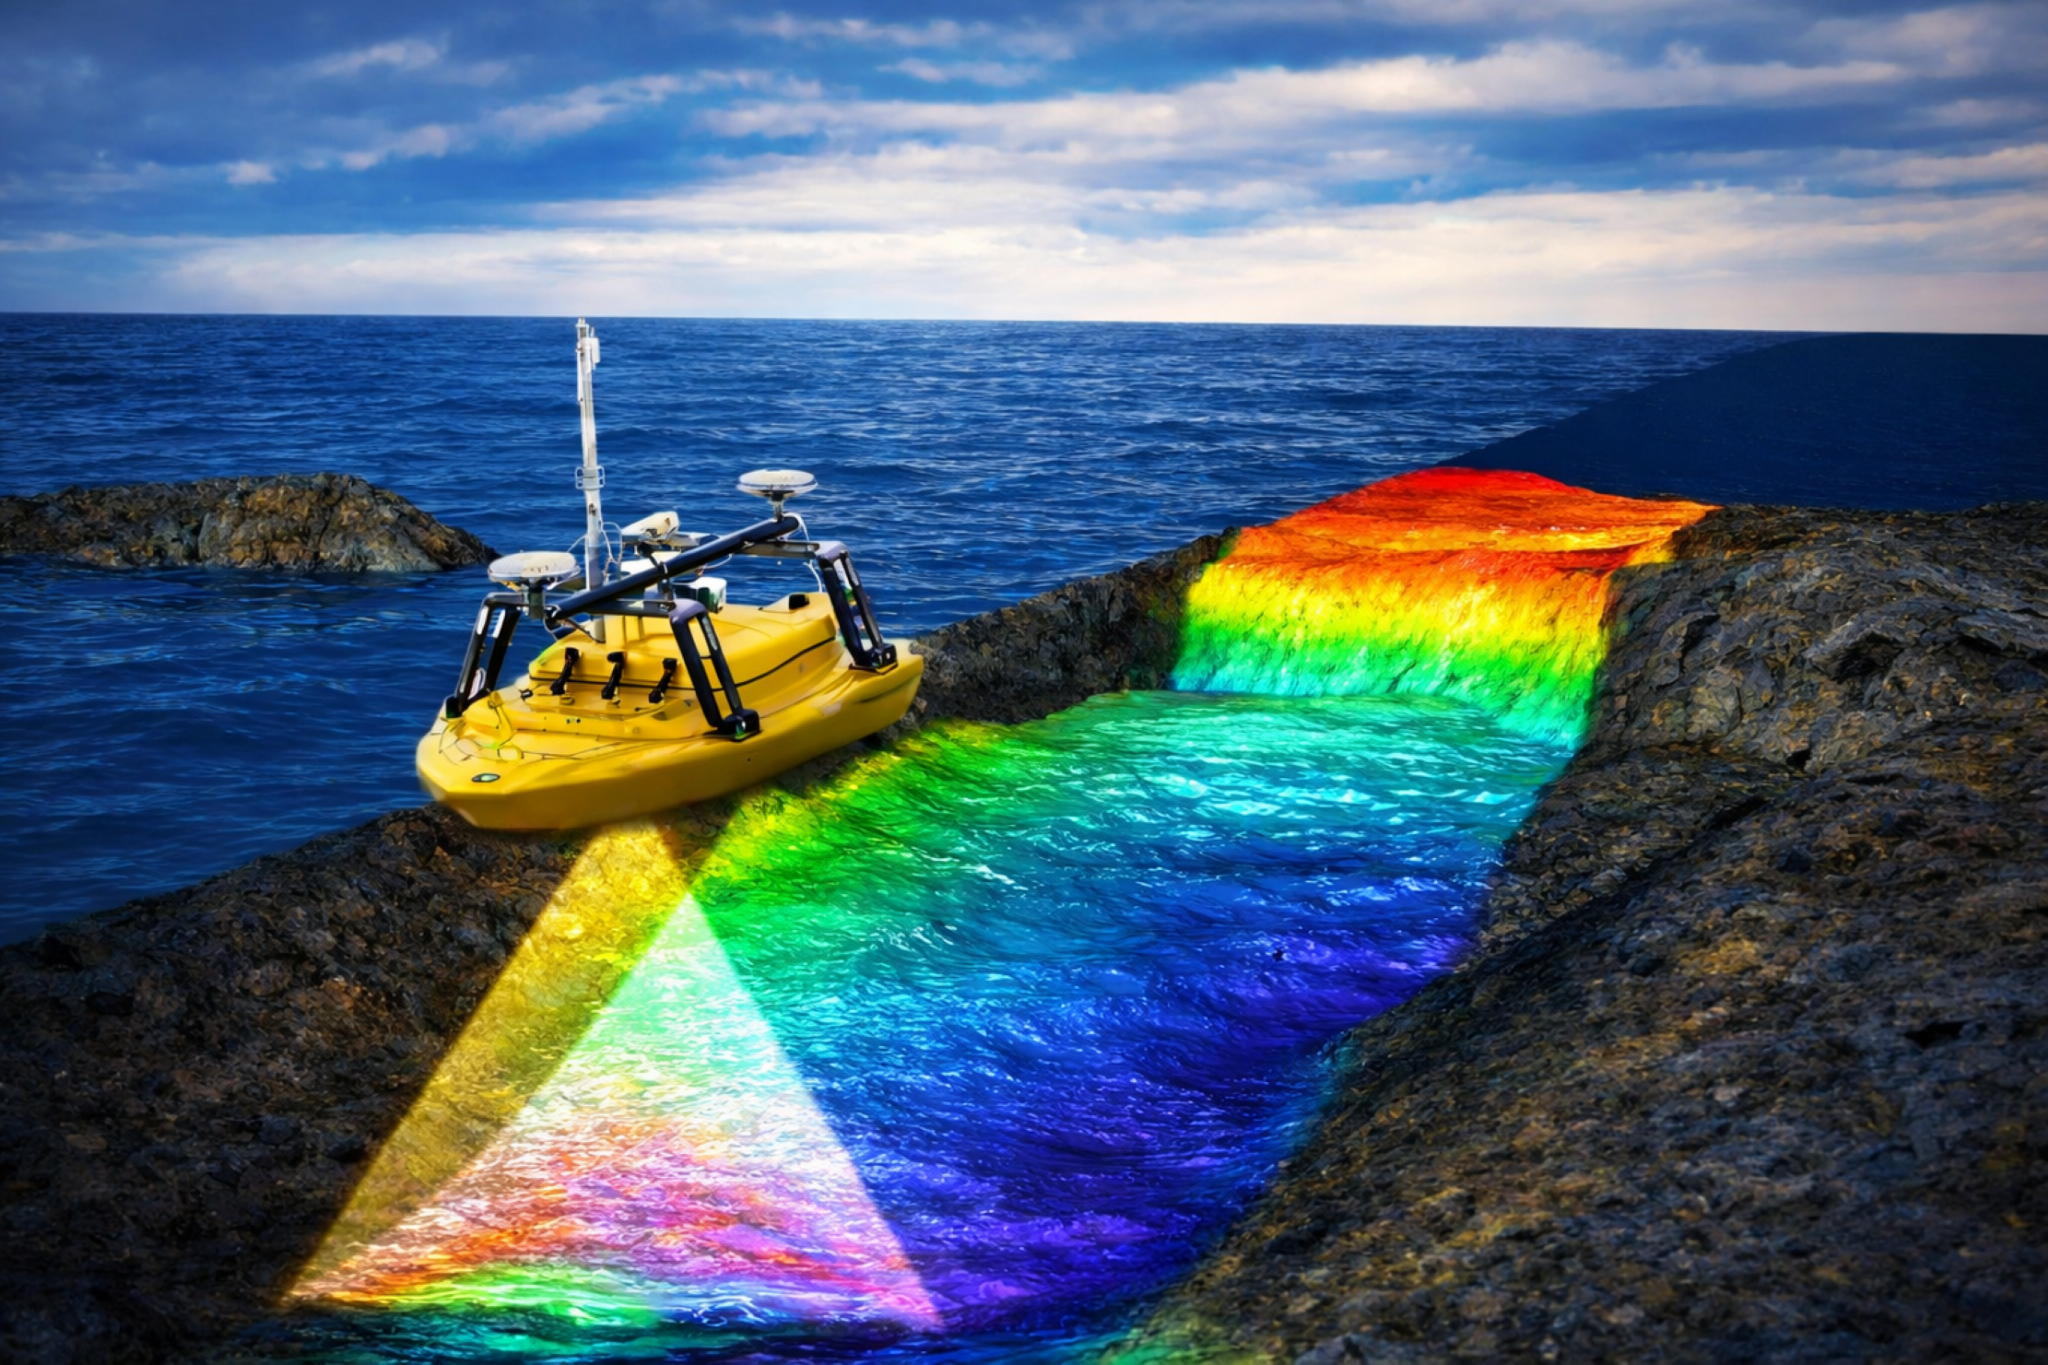
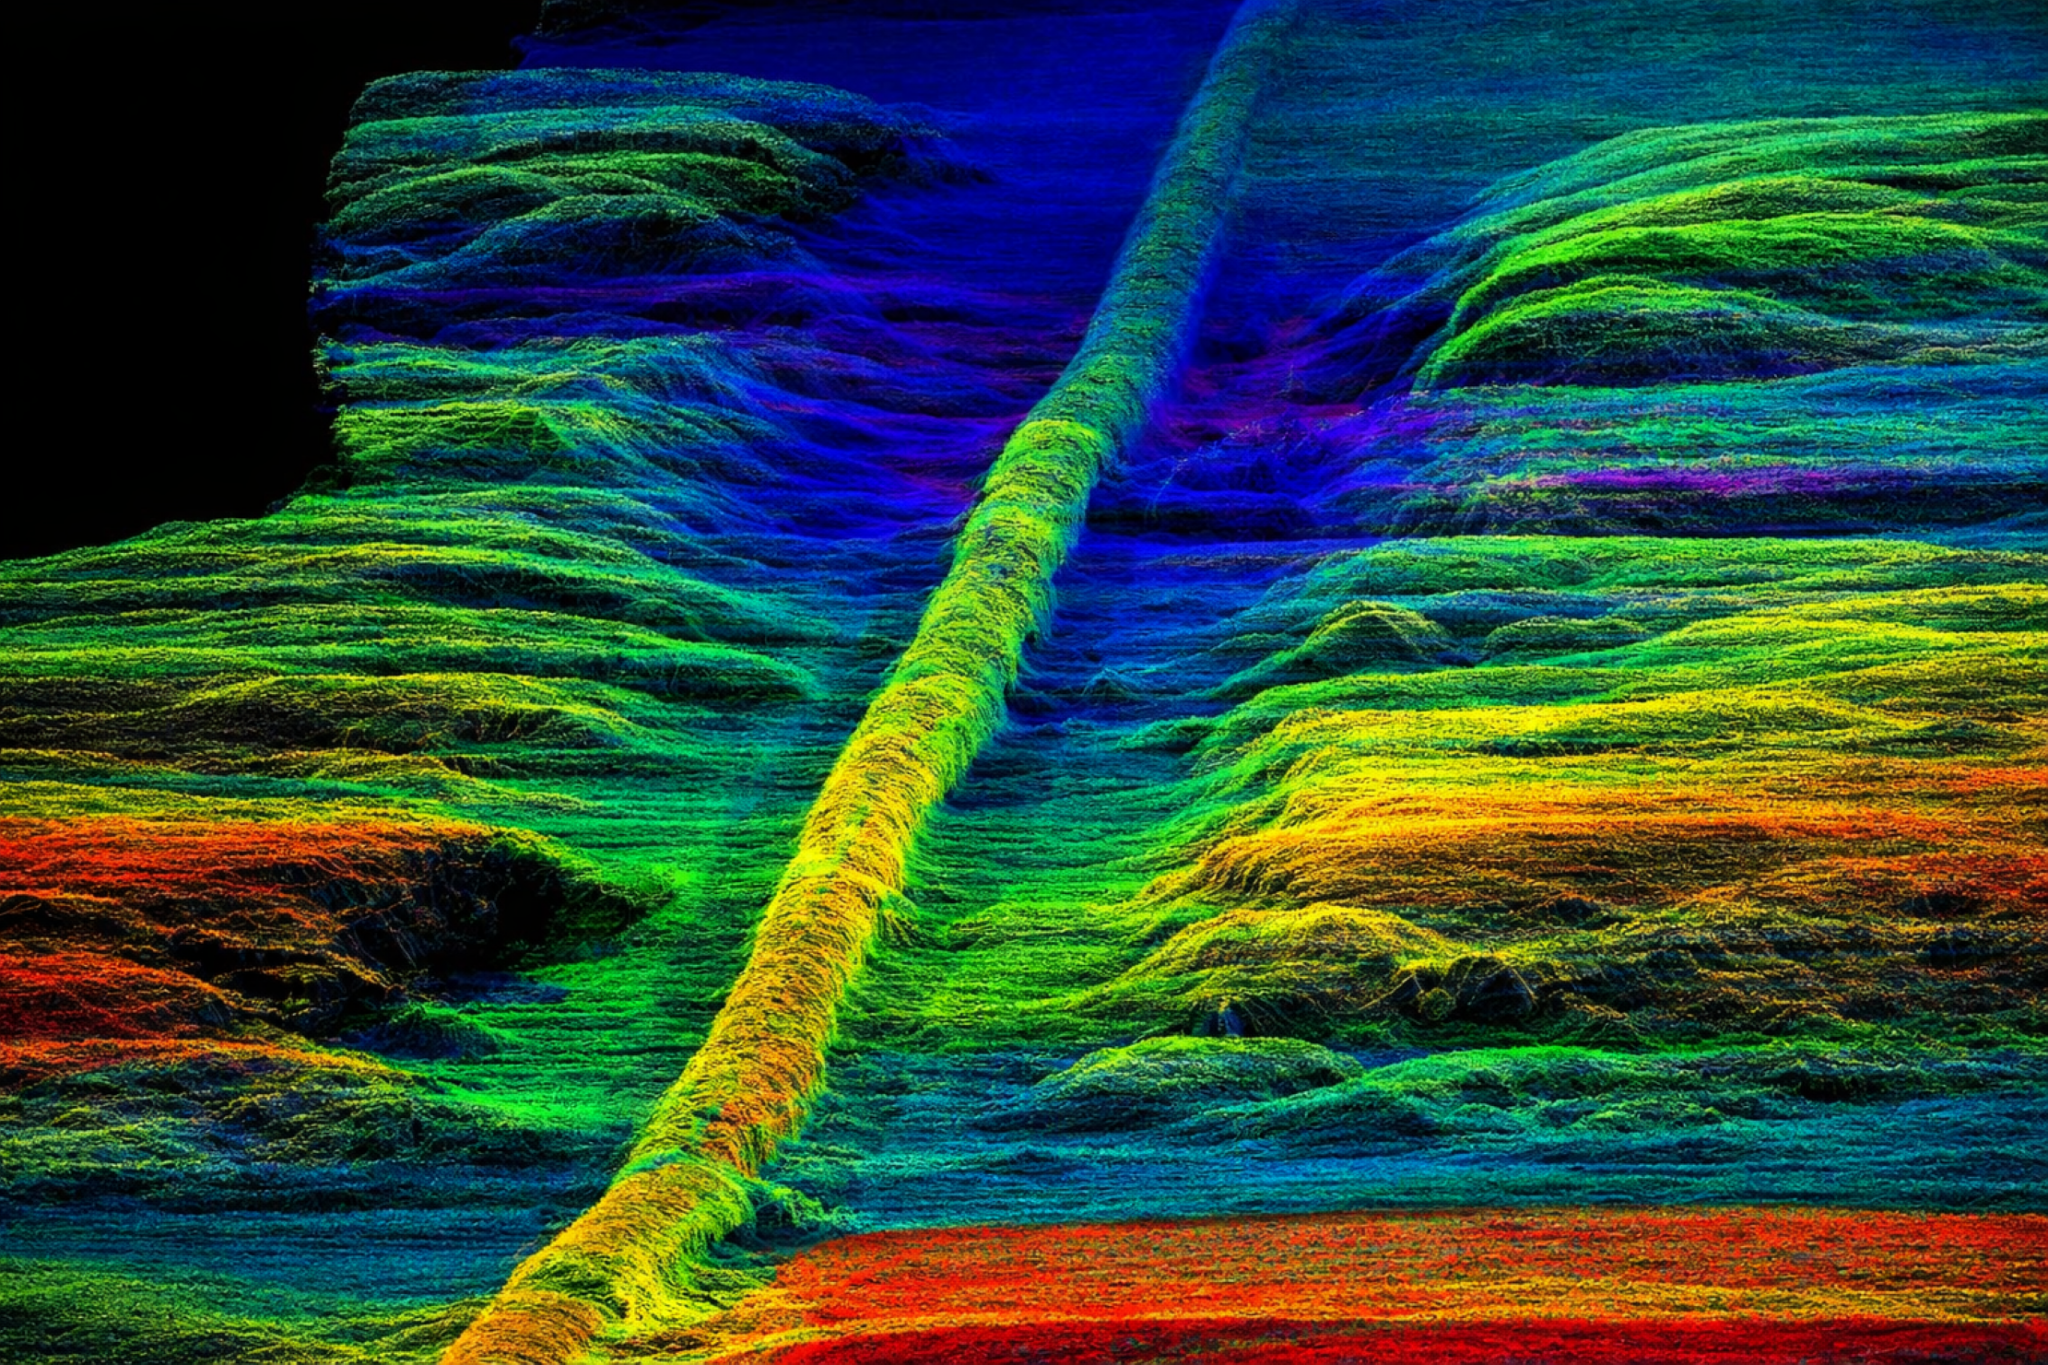
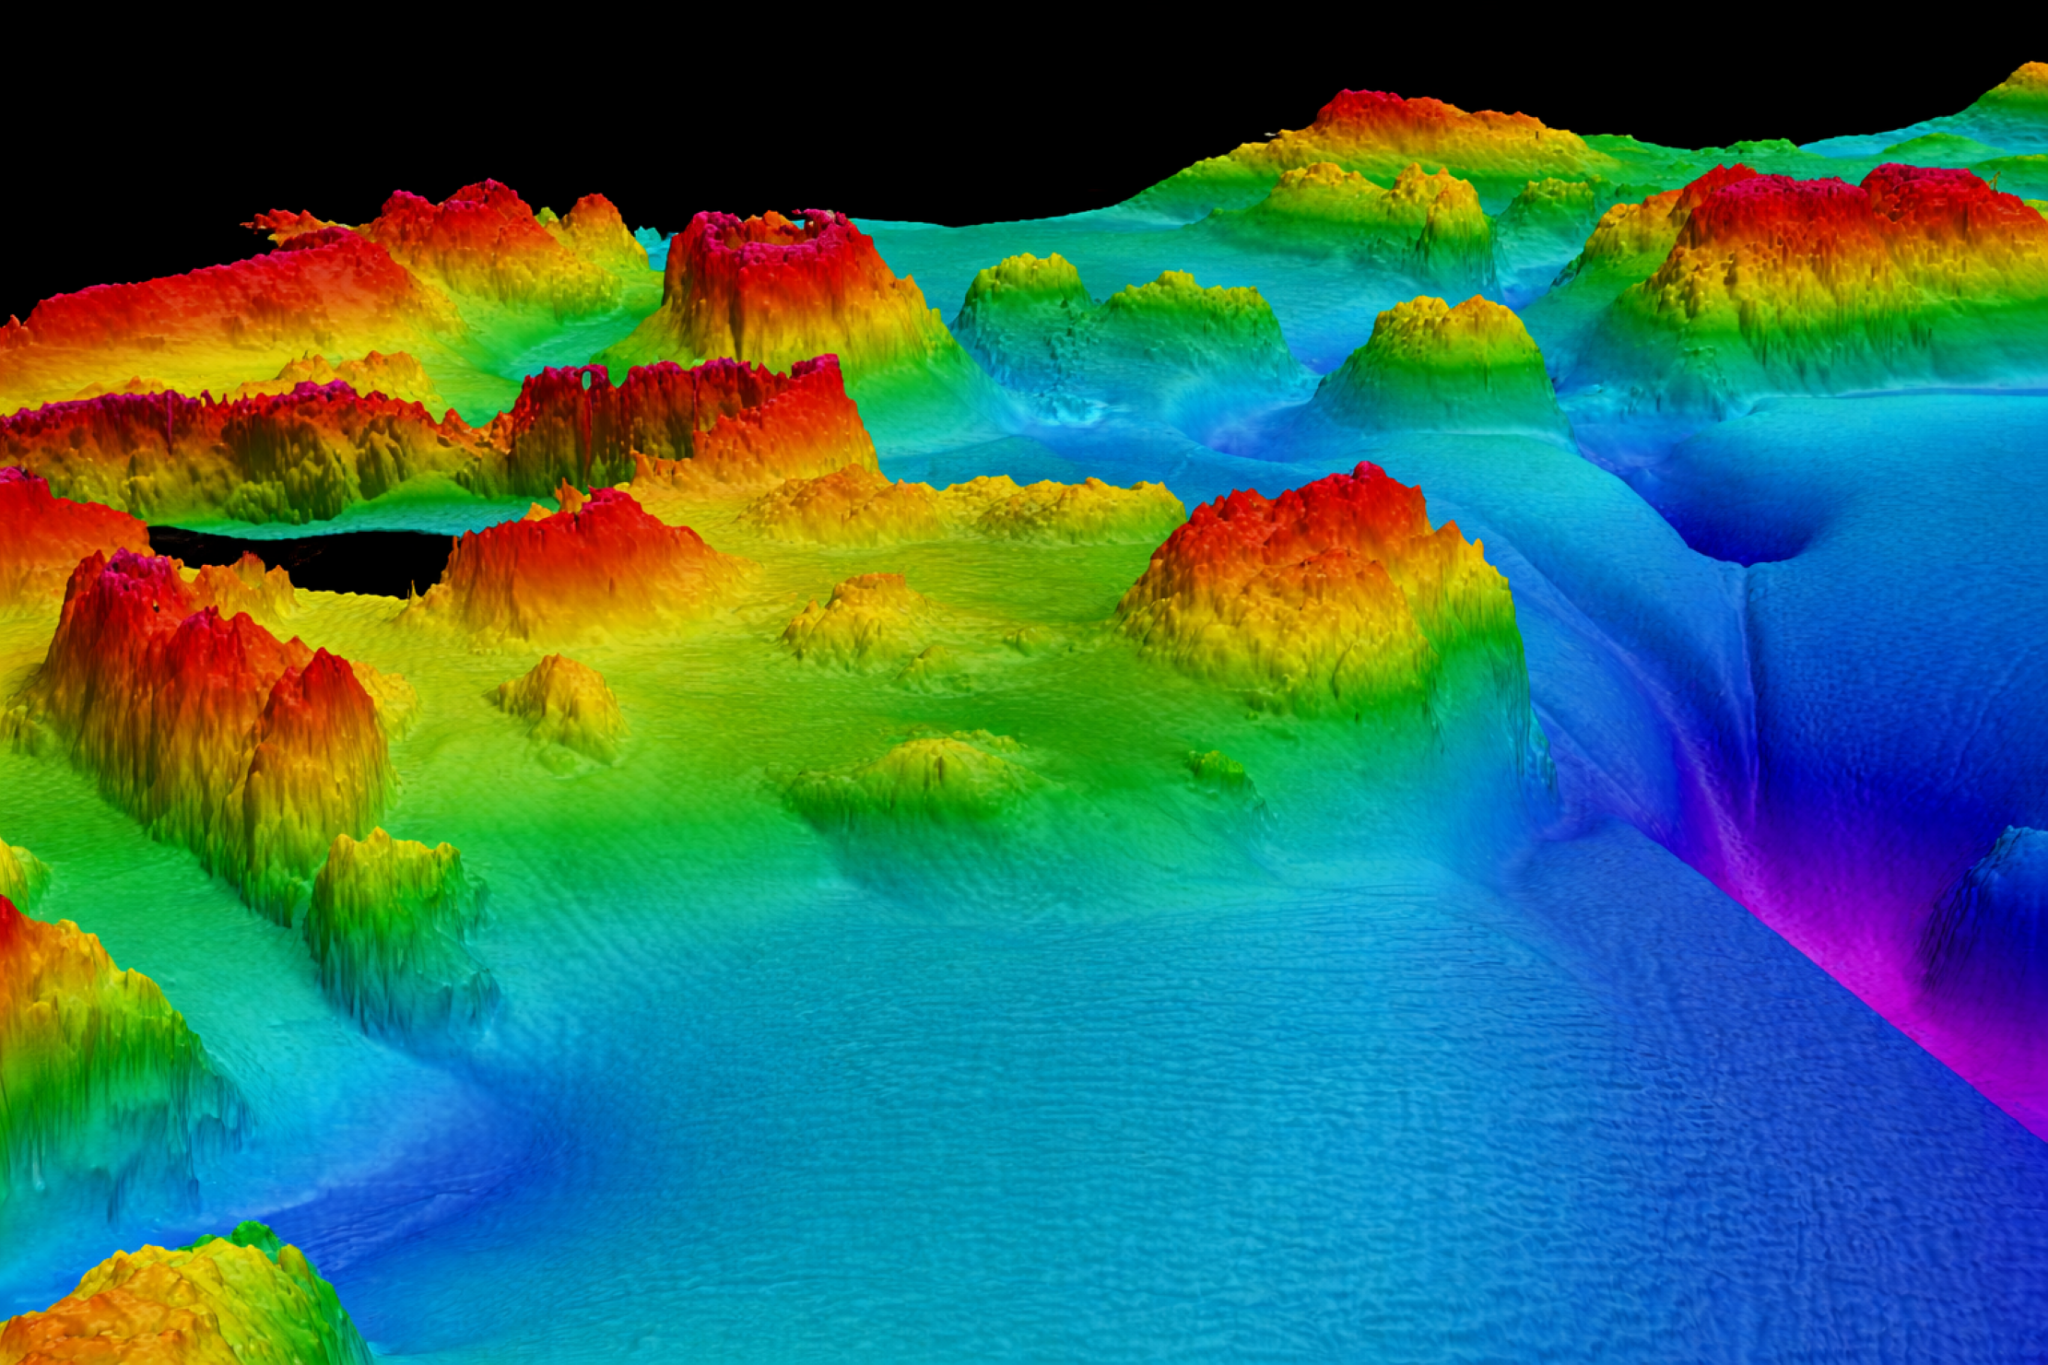
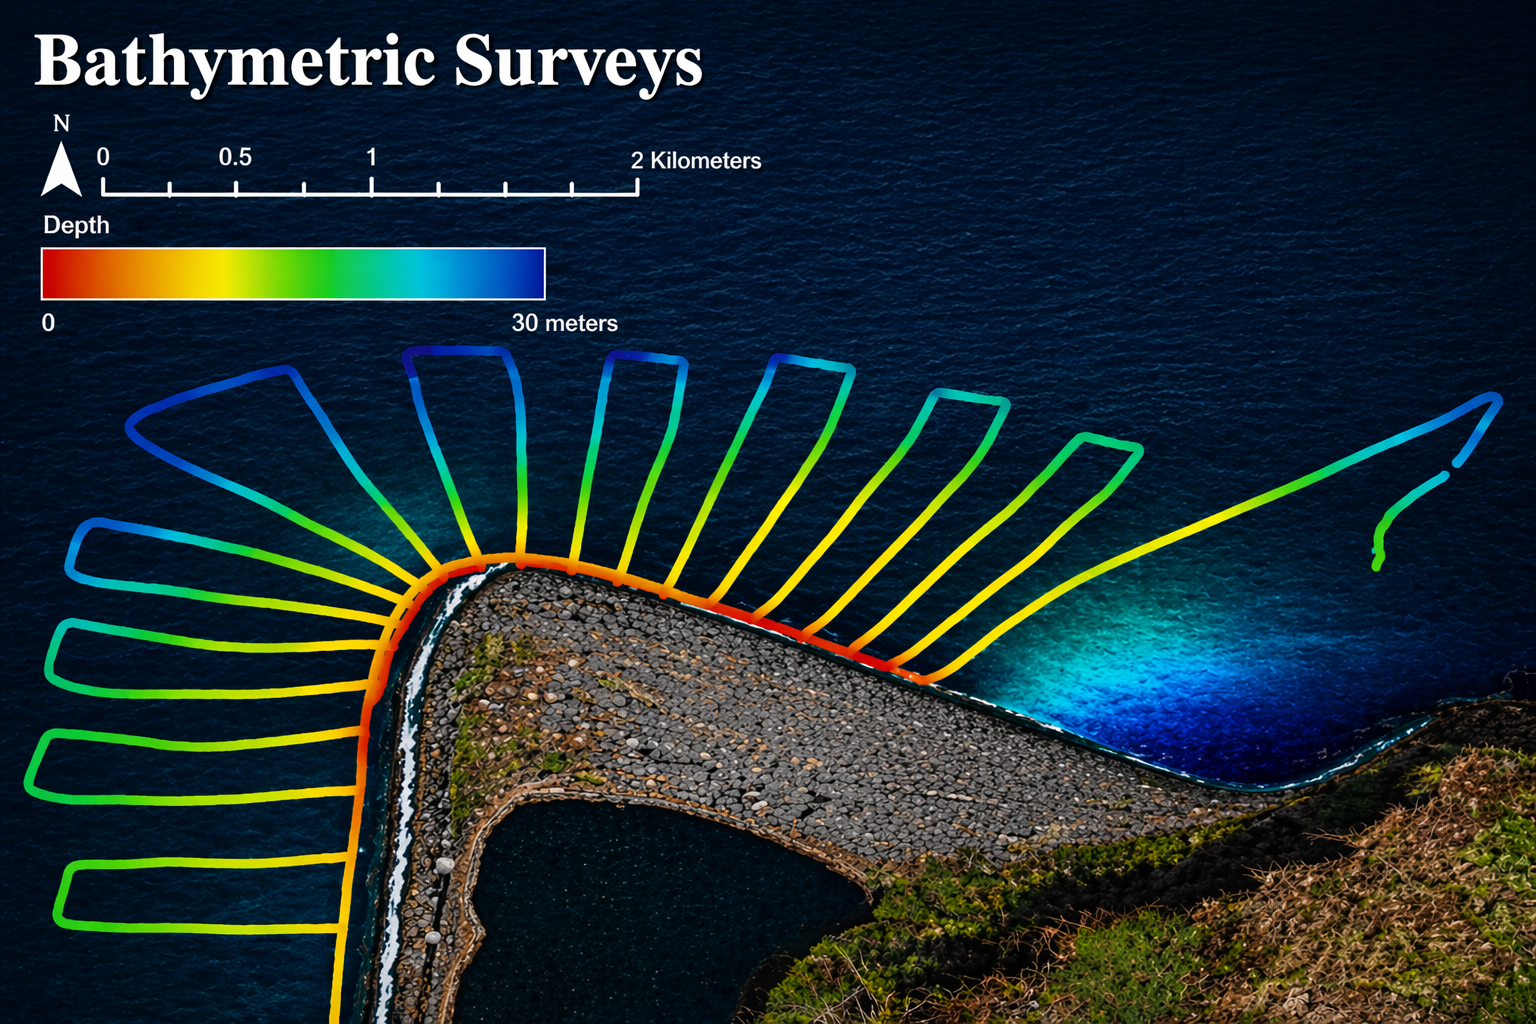
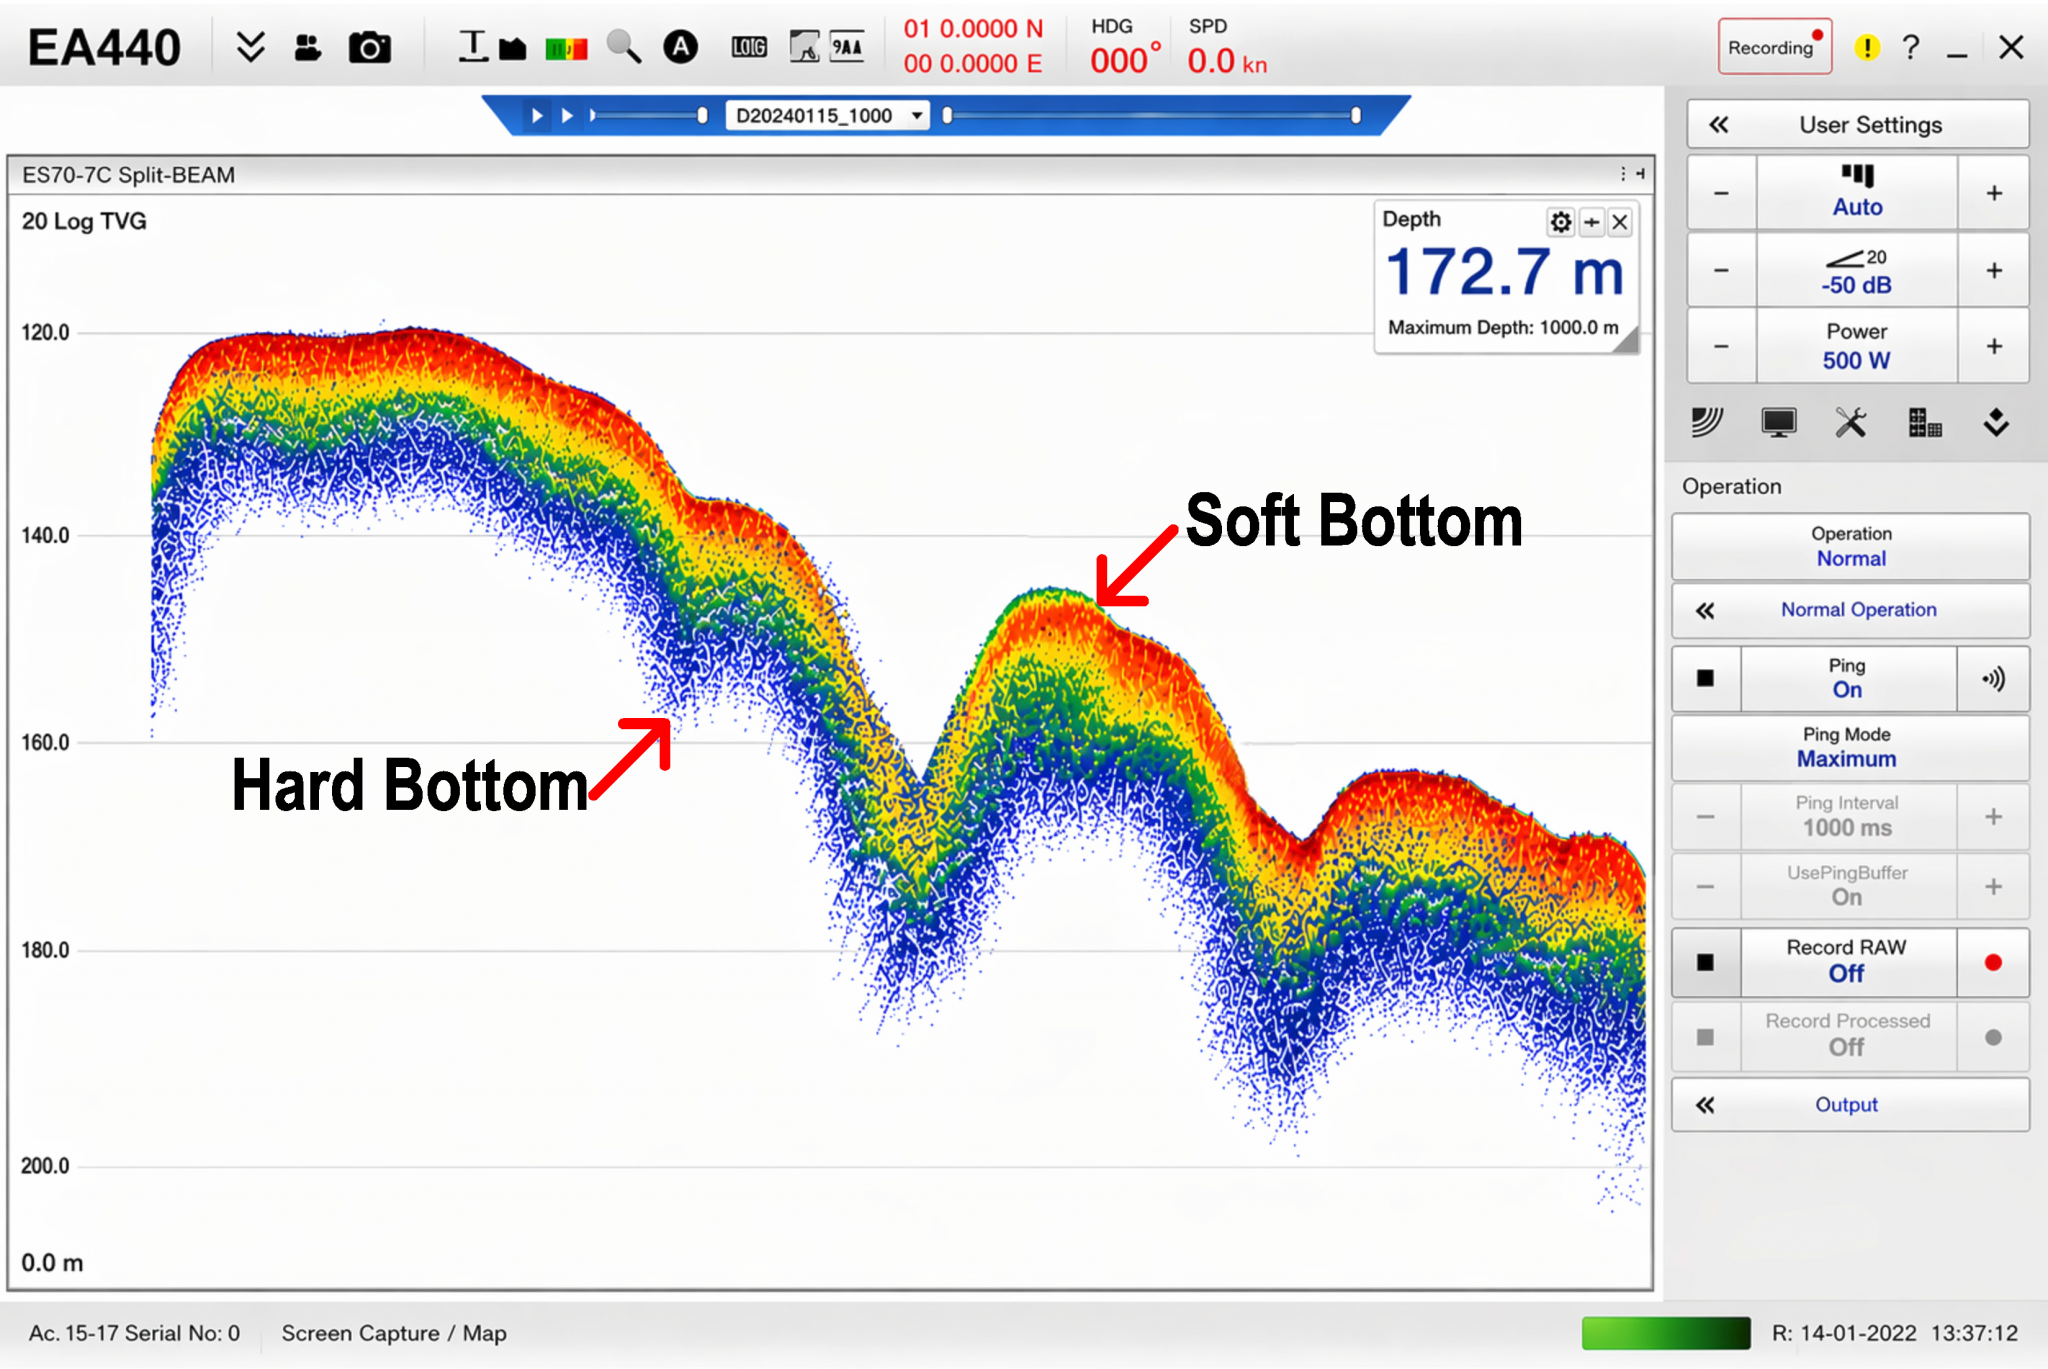
We use advance sonar systems, including single and dual-frequency single-beam echo sounders, multibeam echo sounders, side-scan sonar, and sub-bottom profilers, to provide precise bathymetric data for various water environments, such as rivers and coastlines. Our surveys deliver both raw and processed data, ensuring complete flexibility for your needs.

SINGLE-BEAM BATHYMETRIC Surveys

Our Hydrographic Surveying Capabilities Include:

Single-beam surveys provide an efficient and cost-effective solution for measuring water depth with high accuracy. We use dual-frequency echo sounders for data acquisition, along with industry-leading software to deliver comprehensive, accurate final products.

Advantages:

  • Quick setup and data collection
  • Fast product turnaround times
  • Cost-effective
  • Dual-frequency technology enhances 

      accuracy and redundancy

Applications:

  • Bathymetric Mapping
  • Hard and Soft Bottom Detection
  • Cross Section Plotting
  • Tailing Pond Containment Reports
  • Navigational Chart Production

topographic survey of liard river crossing

Bathymetric Survey Interactive 4
Red color indicates 0.00 to 1.00 meters water depth Explains symbols and colors to interpret map information accurately Blue lines are major contours shown on plan Brown lines are minor contours shown on plan Color gradients show changing water depth from shallow shores to deep waters Yellow color indicates 2.00 to 3.00 meters water depth Orange color indicates 1.00 to 2.00 meters water depth Green color indicates 3.00 to 4.00 meters water depth Cyan color indicates 4.00 to 5.00 meters water depth Royal Blue color indicates 5.00 to 6.00 meters water depth Navy Blue color indicates 6.00 to 7.00 meters water depth Purple color indicates 7.00 to 8.37 meters water depth

Red color indicates 0.00 to 1.00 meters water depth

Explains symbols and colors to interpret map information accurately

Blue lines are major contours shown on plan

Brown lines are minor contours shown on plan

Color gradients show changing water depth from shallow shores to deep waters

Yellow color indicates 2.00 to 3.00 meters water depth

Orange color indicates 1.00 to 2.00 meters water depth

Green color indicates 3.00 to 4.00 meters water depth

Cyan color indicates 4.00 to 5.00 meters water depth

Royal Blue color indicates 5.00 to 6.00 meters water depth

Navy Blue color indicates 6.00 to 7.00 meters water depth

Purple color indicates 7.00 to 8.37 meters water depth

stations 0+000 to 1+000

Bathymetric Survey Interactive 1
ARROW: graphic symbol showing map orientation, indicating the north direction All brown lines are Minor & all blue lines are Major Contours All brown lines are Minor & all blue lines are Major Contours Red color indicates 0.00 to 1.00 meters water depth Orange color indicates 1.00 to 2.00 meters water depth Yellow color indicates 2.00 to 3.00 meters water depth Green color indicates 3.00 to 4.00 meters water depth Cyan color indicates 4.00 to 5.00 meters water depth Green color indicates 3.00 to 4.00 meters water depth Orange color indicates 1.00 to 2.00 meters water depth Red color indicates 0.00 to 1.00 meters water depth Royal Blue color indicates 5.00 to 6.00 meters water depth Chainage and station indicate measured linear distance along the map alignment

ARROW: graphic symbol showing map orientation, indicating the north direction

All brown lines are Minor & all blue lines are Major Contours

All brown lines are Minor & all blue lines are Major Contours

Red color indicates 0.00 to 1.00 meters water depth

Orange color indicates 1.00 to 2.00 meters water depth

Yellow color indicates 2.00 to 3.00 meters water depth

Green color indicates 3.00 to 4.00 meters water depth

Cyan color indicates 4.00 to 5.00 meters water depth

Green color indicates 3.00 to 4.00 meters water depth

Orange color indicates 1.00 to 2.00 meters water depth

Red color indicates 0.00 to 1.00 meters water depth

Royal Blue color indicates 5.00 to 6.00 meters water depth

Chainage and station indicate measured linear distance along the map alignment

stations 1+100 to 2+100

Bathymetric Survey Interactive 2
Royal Blue color indicates 5.00 to 6.00 meters water depth Navy Blue color indicates 6.00 to 7.00 meters water depth Royal Blue color indicates 5.00 to 6.00 meters water depth Navy Blue color indicates 6.00 to 7.00 meters water depth

Royal Blue color indicates 5.00 to 6.00 meters water depth

Navy Blue color indicates 6.00 to 7.00 meters water depth

Royal Blue color indicates 5.00 to 6.00 meters water depth

Navy Blue color indicates 6.00 to 7.00 meters water depth

stations 2+200 to 3+100

Bathymetric Survey Interactive 3
Navy Blue color indicates 6.00 to 7.00 meters water depth Purple color indicates 7.00 to 8.37 meters water depth

Navy Blue color indicates 6.00 to 7.00 meters water depth

Purple color indicates 7.00 to 8.37 meters water depth

overview of liard river crossing - stations 0+000 to 3+100

Bathymetric Survey Interactive 5
Scale

Scale

SINGLE BEAM BATHYMETRIC Survey Video

MULTIBEAM BATHYMETRIC Surveys

Multibeam surveys provide a richer, more detailed view of underwater topography. By using multibeam echo sounders, we offer 100% bottom coverage, making it ideal for precise infrastructure planning and analysis.

Application:

  • Underwater Pipe Location
  • Bride Buttress Mapping Analysis
  • Detailed Floor Mapping – Ice Scouring
  • High Resolution Wharf & Marina Mapping
  • Pre-Dredging, Post-Dredging Volume Surveys & Cross-Sections
Advantages:
  • Full bottom coverage for comprehensive data collection
  • Ability to survey a wide swath
  • Detailed data allows for accurate subsea mapping

side-scan sonar

Side-scan sonar provides a highly detailed image of the seafloor. This technology is ideal for identifying and mapping underwater features such as wrecks, pipelines, and other structures.

sub-bottom profiling

Sub-bottom profiling allows us to visualize the sediment layers beneath the seafloor, providing valuable insight into subsurface conditions. This data is essential for site assessments in offshore construction and environmental surveys for dredging and mining projects.

multibeam bathymetric survey video

Comments are closed.